AI Trading Dashboard for
Active Traders
Replace 10 browser tabs with one dashboard. TradeAI News puts your scored event feed, unusual-volume detection, sector heatmap, momentum scanner, watchlist, and financial calendar in a single, fast interface — with AI scoring on every event.
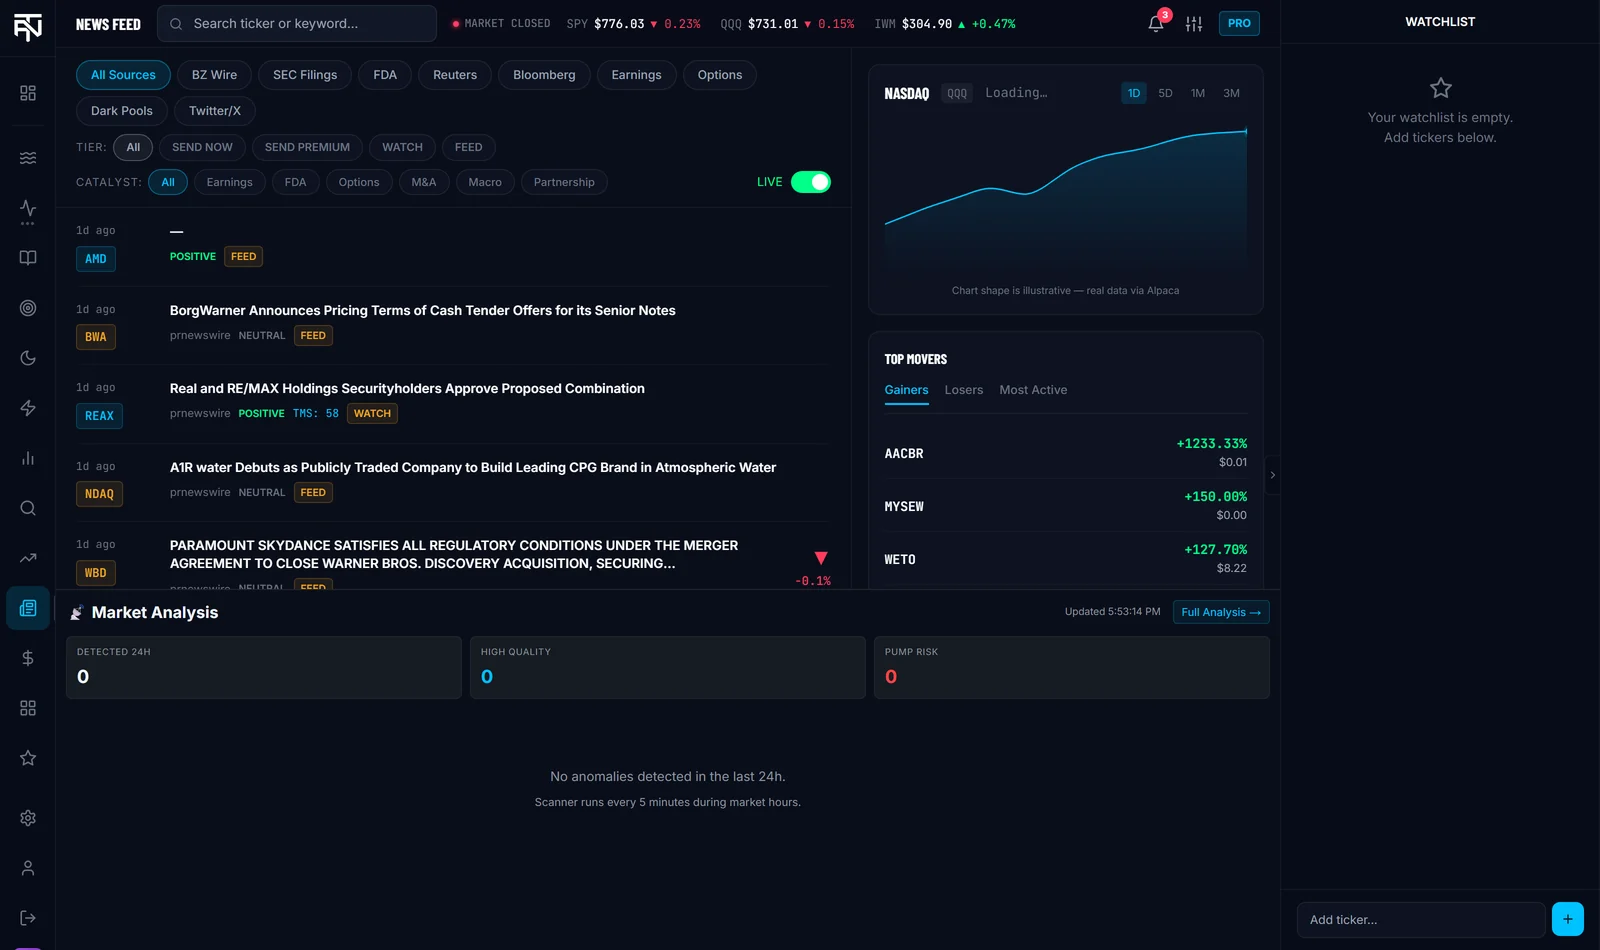
8 Sections, One Platform
The TradeAI News dashboard is organized around the complete information workflow of an active US equity trader: monitoring events, reviewing scored events, checking options and institutional positioning, scanning the broader momentum landscape, tracking your watchlist, and planning around scheduled catalysts. Every section is accessible from the sidebar, and you can customize which sections appear based on your trading style.
Designed for Speed, Not Complexity
The dashboard updates via WebSocket as signals are published, and each carries its own detection timestamp in your dashboard. The interface is deliberately minimal — every element serves a function, and there is no marketing noise or educational content in the trading interface itself.
The top bar shows live ticker prices for major indices, a notification bell for unread signals, a search bar for quick ticker lookup, and your current plan badge. The sidebar provides one-click navigation between sections. Sections you don't use can be hidden via the Customize button.
Plan Comparison — What You Get
Frequently Asked Questions
What is included in the TradeAI News dashboard?
The dashboard is organized into sections: News Feed (all detected events from the named feeds), Signals (events above the TMS 55 threshold), Market Analysis/Scanner (momentum candidates and sector heatmap), Unusual Volume (relative-volume detection), Watchlist (your tracked tickers with highlighted events), Financial Calendar (scheduled upcoming catalysts), and My Account/Settings. Which sections you can access depends on your plan — Basic includes News Feed, Signals, Watchlist, and Calendar; Pro adds Unusual Volume and Market Analysis; Elite adds API access.
Is the dashboard a web app or a downloadable application?
The TradeAI News dashboard is a web application accessible at tradeainews.com/dashboard in any modern browser. There is no downloadable desktop or mobile application. The dashboard is responsive and works on mobile browsers, though the optimal experience is on a desktop or large tablet screen where multiple panels can be visible simultaneously. Because it is a web app, there are no installation requirements, and you have access from any device with a browser and internet connection.
How do I log in to the dashboard?
TradeAI News uses a passwordless login system via one-time password (OTP). To log in, visit tradeainews.com/login, enter your email address, and request an OTP code. A 6-digit code will be sent to your email — enter it to complete login. The session is stored in your browser and persists for 30 days unless you log out. No password is stored or required. If you have connected your Telegram, you will also receive a login notification via Telegram when a new session begins.
Can I customize the dashboard layout?
Yes. The dashboard includes a Customize view (gear icon in the top bar) that allows you to toggle sections on or off and set your default view when you open the dashboard. Sections you don't use (e.g., Financial Calendar if you don't trade earnings) can be hidden from the sidebar to reduce clutter. Your default view preference is saved per account, so the dashboard opens to your preferred section across all devices.
How quickly does the dashboard update?
The News Feed, Insights and Unusual Volume sections all update as new data arrives from the pipeline. There is no need to refresh the page — new events appear at the top of each feed as they are published. The dashboard uses a WebSocket connection to receive live updates, falling back to polling if WebSocket is unavailable. A connection status indicator in the top bar shows whether you are connected to the live feed or experiencing a delay.
What is the difference between the News Feed and Signals tabs?
The News Feed shows all events detected by the pipeline that have cleared a minimum quality threshold — this includes informational events, lower-significance catalysts, and contextual market intelligence. The Signals tab shows only events that have cleared the actionable TMS threshold (≥ 55 for WATCH, ≥ 68 for SEND PREMIUM, ≥ 82 for SEND NOW). The Signals tab is a higher-significance subset of the News Feed. Most traders monitor the Signals tab for trading decisions and the News Feed for broader market awareness.
Open your AI trading dashboard today
Free plan available. No credit card required. Upgrade anytime.
Not financial advice. Trading involves risk.
Last updated September 8, 2026