One context layer. 10 views. Every screen real.
Event intelligence, market structure, and your own trading — welded together. Every section below is a real capture of the product, and every number on this page traces to our data or our code. We measure significance and magnitude, not direction — here's why.
Event intelligence
The engine that started it all: named news and regulatory feeds monitored continuously, every detected event classified and scored 0–100 for significance — how much the event resembles those that historically preceded large moves. Magnitude and significance, never direction.
- ▸Catalyst classification: earnings, FDA, M&A, halts, offerings and more — 40 distinct event types observed in the last 30 days
- ▸Tone assessment labels the language of the source text (favourable/unfavourable) — a property of the text, not a forecast
- ▸Fast-track handling for time-critical events (FDA decisions, M&A, trading halts)
- ▸Telegram delivery on paid plans; we stamp the exact dispatch time of every alert, and will publish the measured median once there is enough data to report one
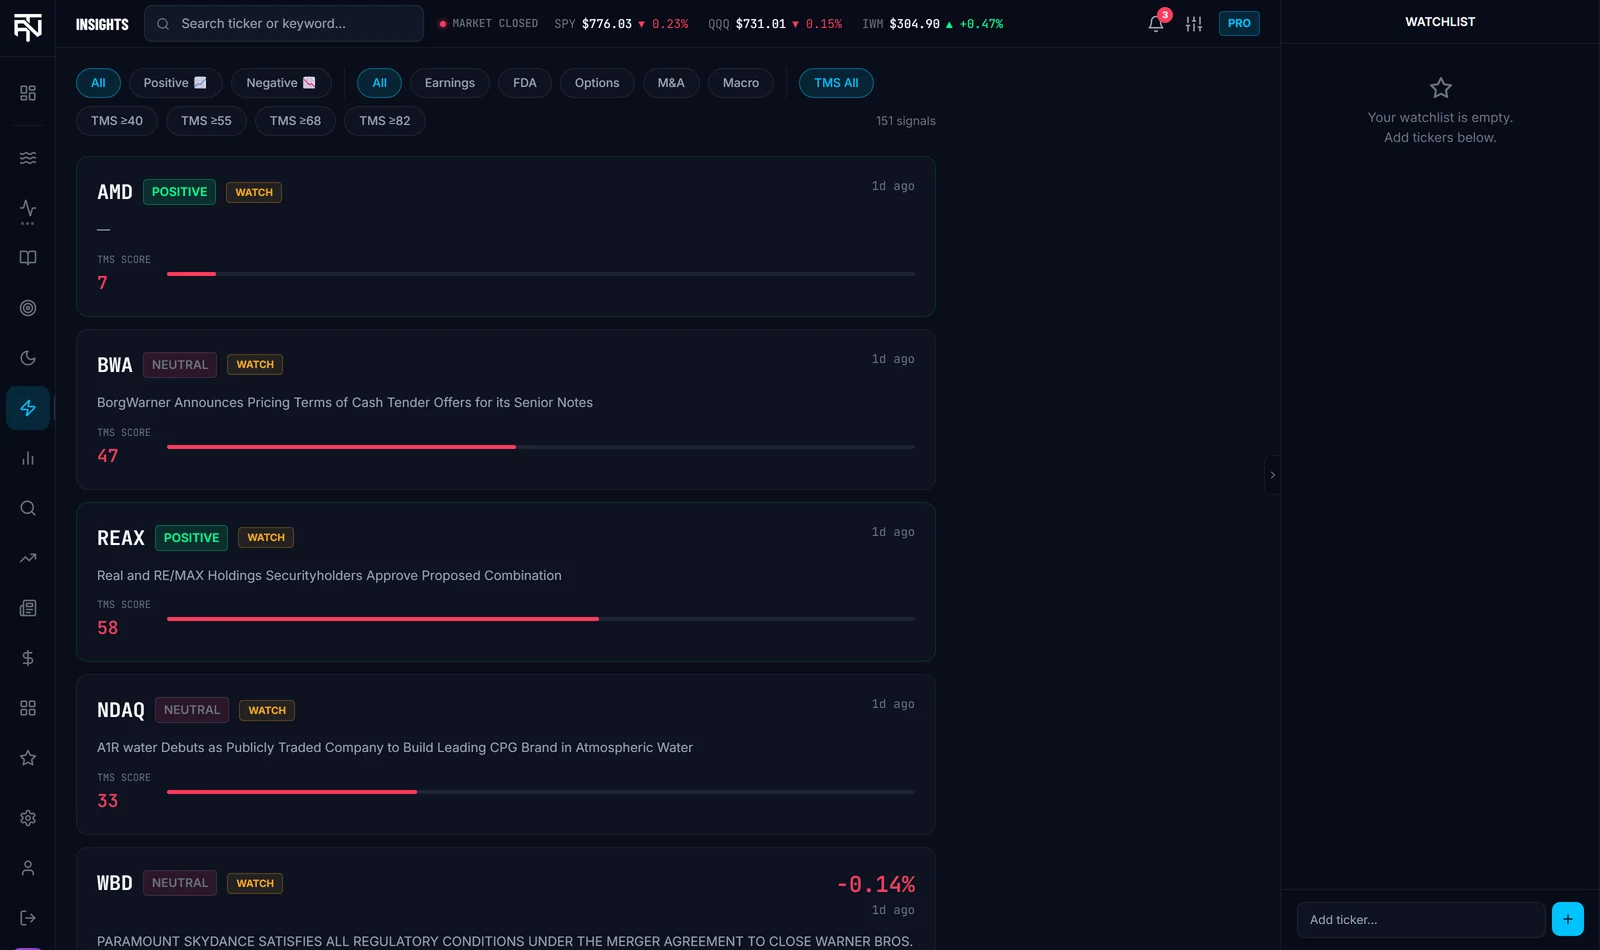
Real dashboard — live market data.
Gamma exposure & expected moves
GEX for any US-listed ticker plus native SPX and DJX index chains (Nasdaq-100 served as a labeled QQQ proxy). Gamma is computed, not bought: Black-Scholes from bid-ask implied volatility, OCC open interest printed on the chart. Walls, flip, dealer regime and the straddle-implied expected move.
- ▸Net GEX by strike, gamma flip, call/put walls, dealer regime (dampening/amplifying)
- ▸Expected moves from actual option pricing, per window (0-7 / 0-30 / 0-45 DTE)
- ▸Index levels snapshotted every 5 minutes in market hours — the same snapshots that feed the journal
- ▸The methodology is on the page, not behind a support ticket
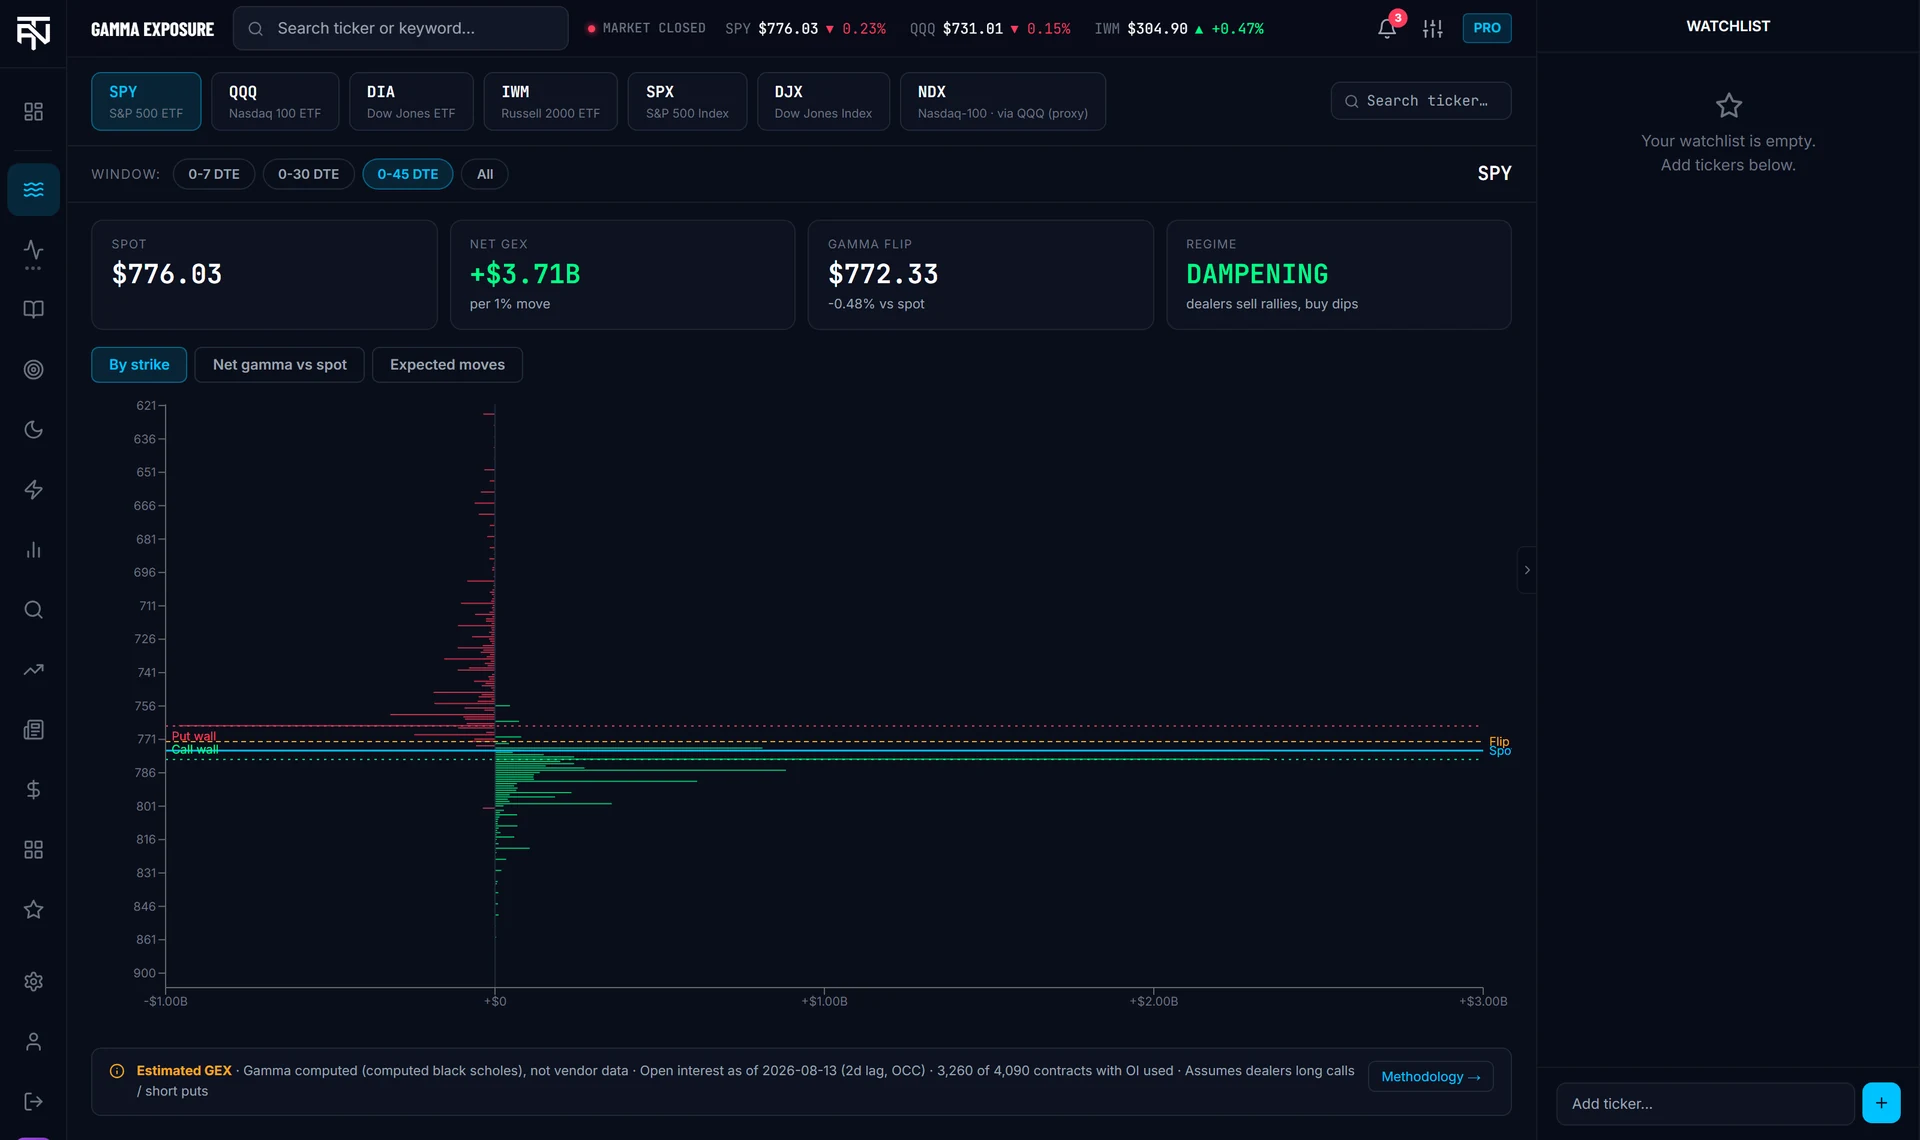
Real dashboard — live market data, methodology note on the chart.
See the live public SPY view →Context-aware trade journal
Import your fills (CSV/XLSX, multi-broker, index CFDs mapped to their reference indices) and every trade freezes the market context at entry: gamma regime, active catalyst, macro calendar, market regime, VWAP and 1-minute price structure. Your journal stops being a P&L list and becomes a record of decisions inside conditions.
- ▸Per-trade frozen context: gamma at entry, catalyst, macro events, regime, MFE/MAE excursion
- ▸R-multiples from your own stops; MFE give-back; equity curve that separates deposits from P&L
- ▸Per-account capital, leverage and currency; re-imports backfill without duplicating
- ▸AI retrospective note per trade — strictly non-directional by construction, checked by a deterministic guardrail
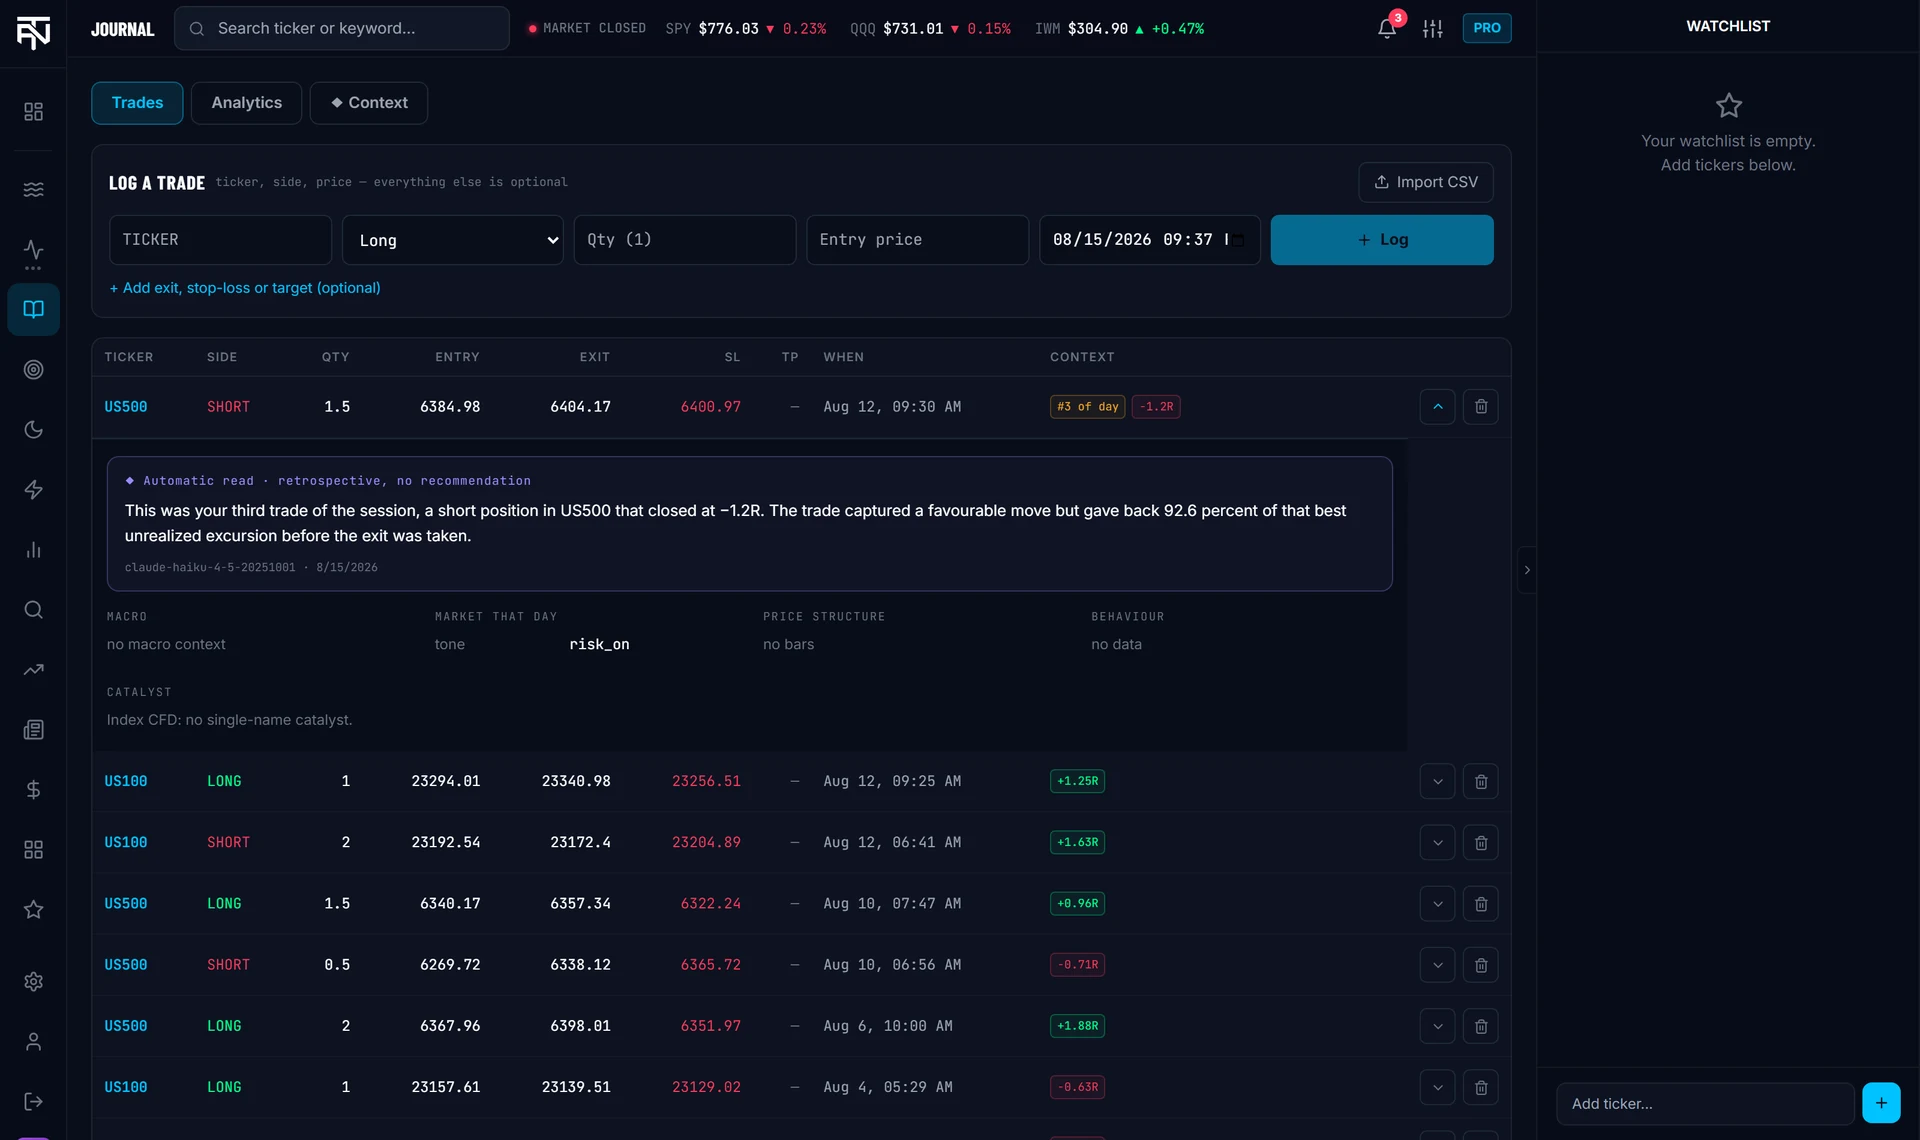
Real dashboard, demo account — the AI note shown is a real pipeline generation (retrospective, non-directional), not copywriting.
How the Context Journal works →Context Analytics
The cross an execution-only journal cannot draw: your performance against the market regime at each entry, catalyst type, MFE give-back, R-multiple distribution, revenge re-entries and order-in-day patterns. Blocks without enough data say so — with the reason — instead of drawing confident charts from three trades.
- ▸P&L by market regime (risk-on / risk-off / mixed, labeled from how SPY and QQQ actually closed)
- ▸Behavioural patterns computed from your own fills — descriptive, never a verdict
- ▸Gamma-regime and wall-distance blocks fill as new trades accumulate gamma context
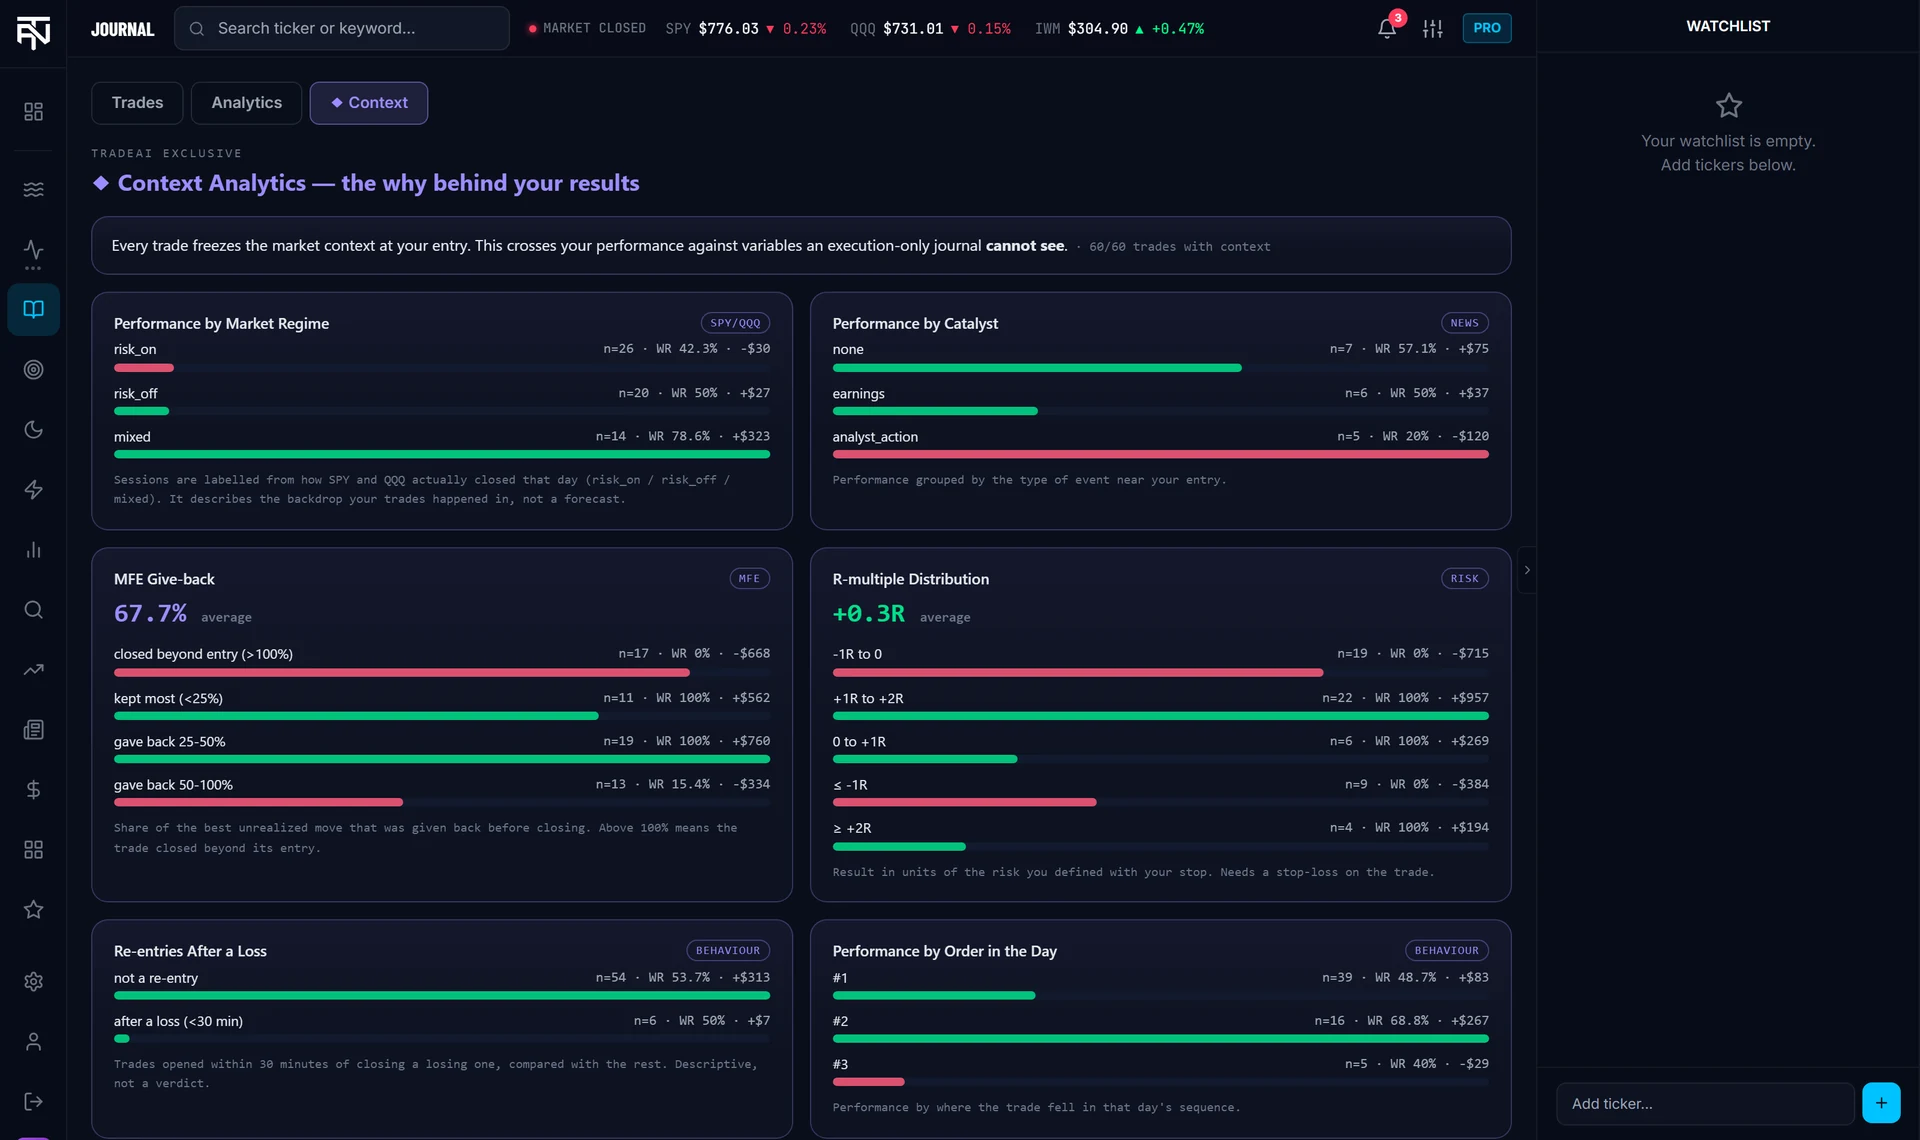
Real dashboard, demo account — illustrative data, not a performance claim.
Analyst accuracy tracking
Every platform shows analyst ratings. In the dashboard, each rating in the feed carries the issuing firm’s own measured hit rate, with the sample size next to it.
- ▸Market-wide ratings feed with per-firm hit rates at 21 trading days
- ▸A historical hit rate describes past calls; it does not grade the next one, and we say so
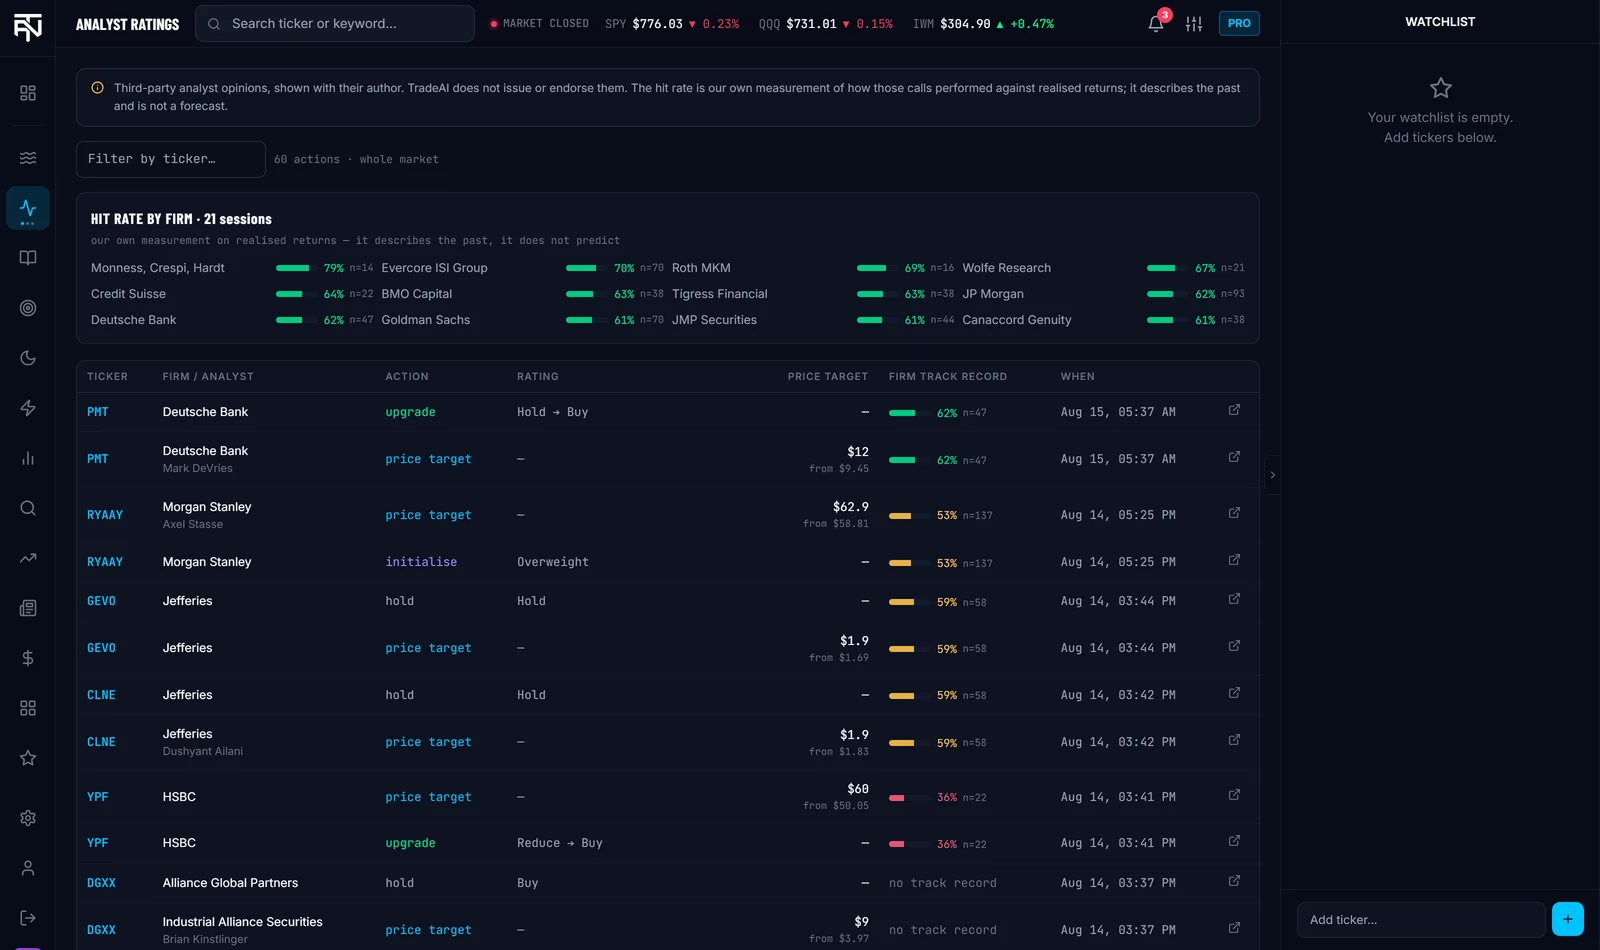
Real dashboard — live market data.
Short interest & FTD
FINRA consolidated short interest for US-listed symbols, cycle by cycle — shares short, % of float, days to cover, cycle-over-cycle change — plus SEC fails-to-deliver. The data is inherently delayed (FINRA ~2 weeks, FTD ~6), so every row prints its settlement date and age instead of pretending to be live.
- ▸As-of date and age per row, flagged when stale
- ▸Descriptive structure: a large short position is a fact, not a squeeze forecast
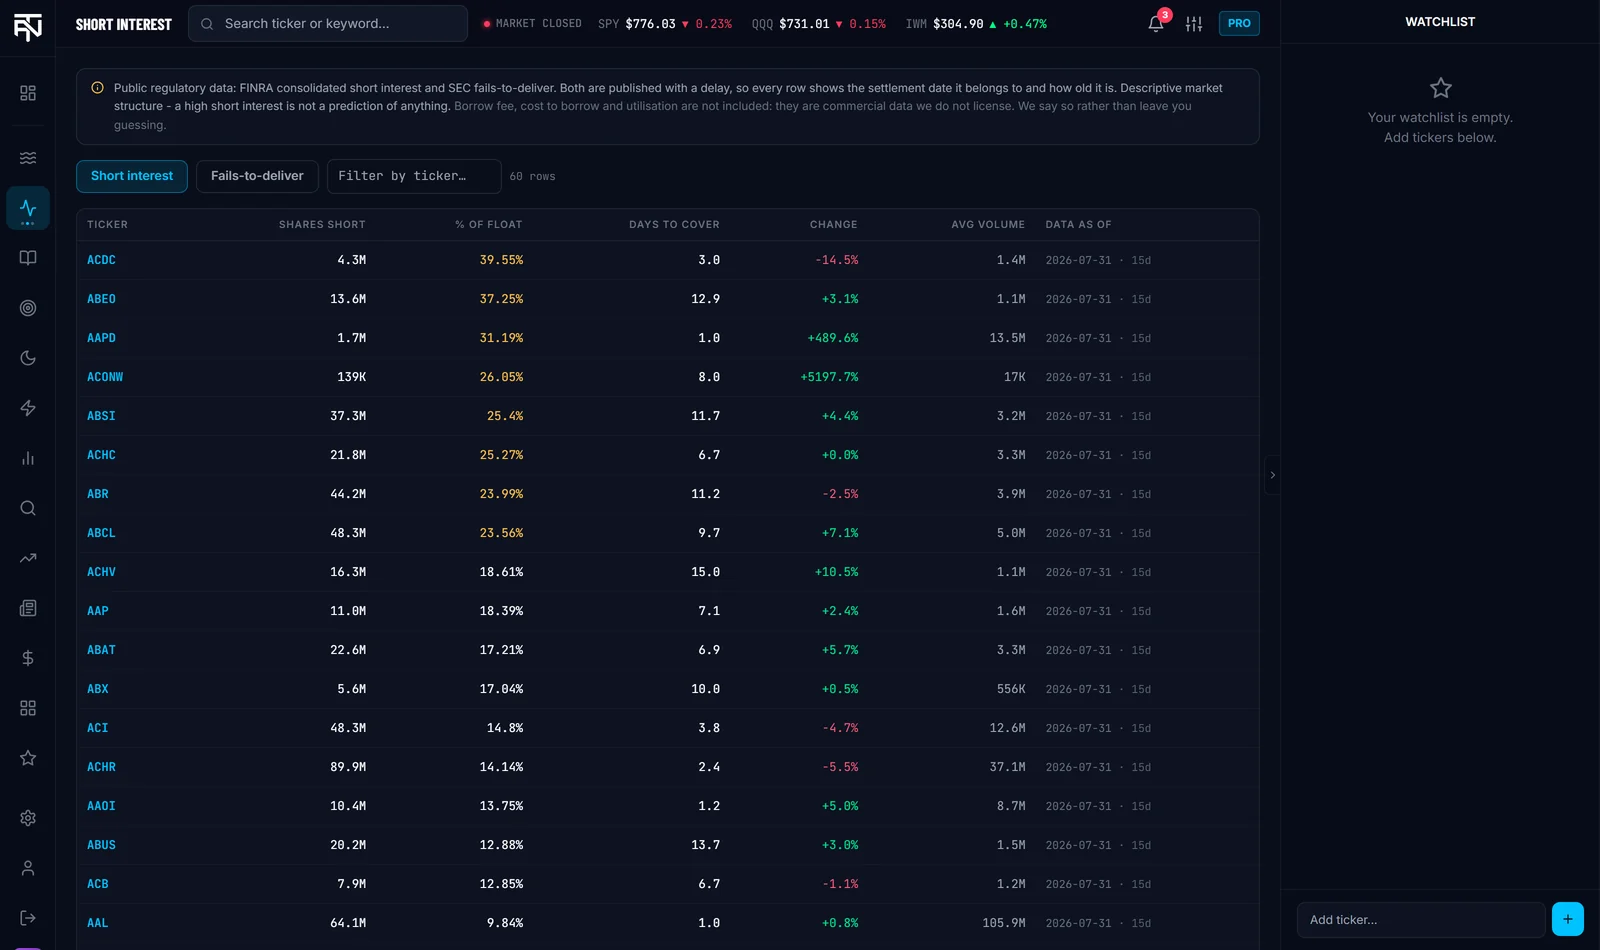
Real dashboard — regulatory data with as-of dates on every row.
How the tracker works →Insider activity (Form 4)
SEC Form 4 filings with the compensation noise removed: open-market purchases and sales (codes P and S) by default, cluster-buying detection when several insiders buy the same name within 30 days, and the filing lag printed per row. Every row links to the original filing on SEC.gov.
- ▸Who traded, their role, size, price — attribution is the point
- ▸Grants and option exercises excluded by default (one toggle shows everything, explained)
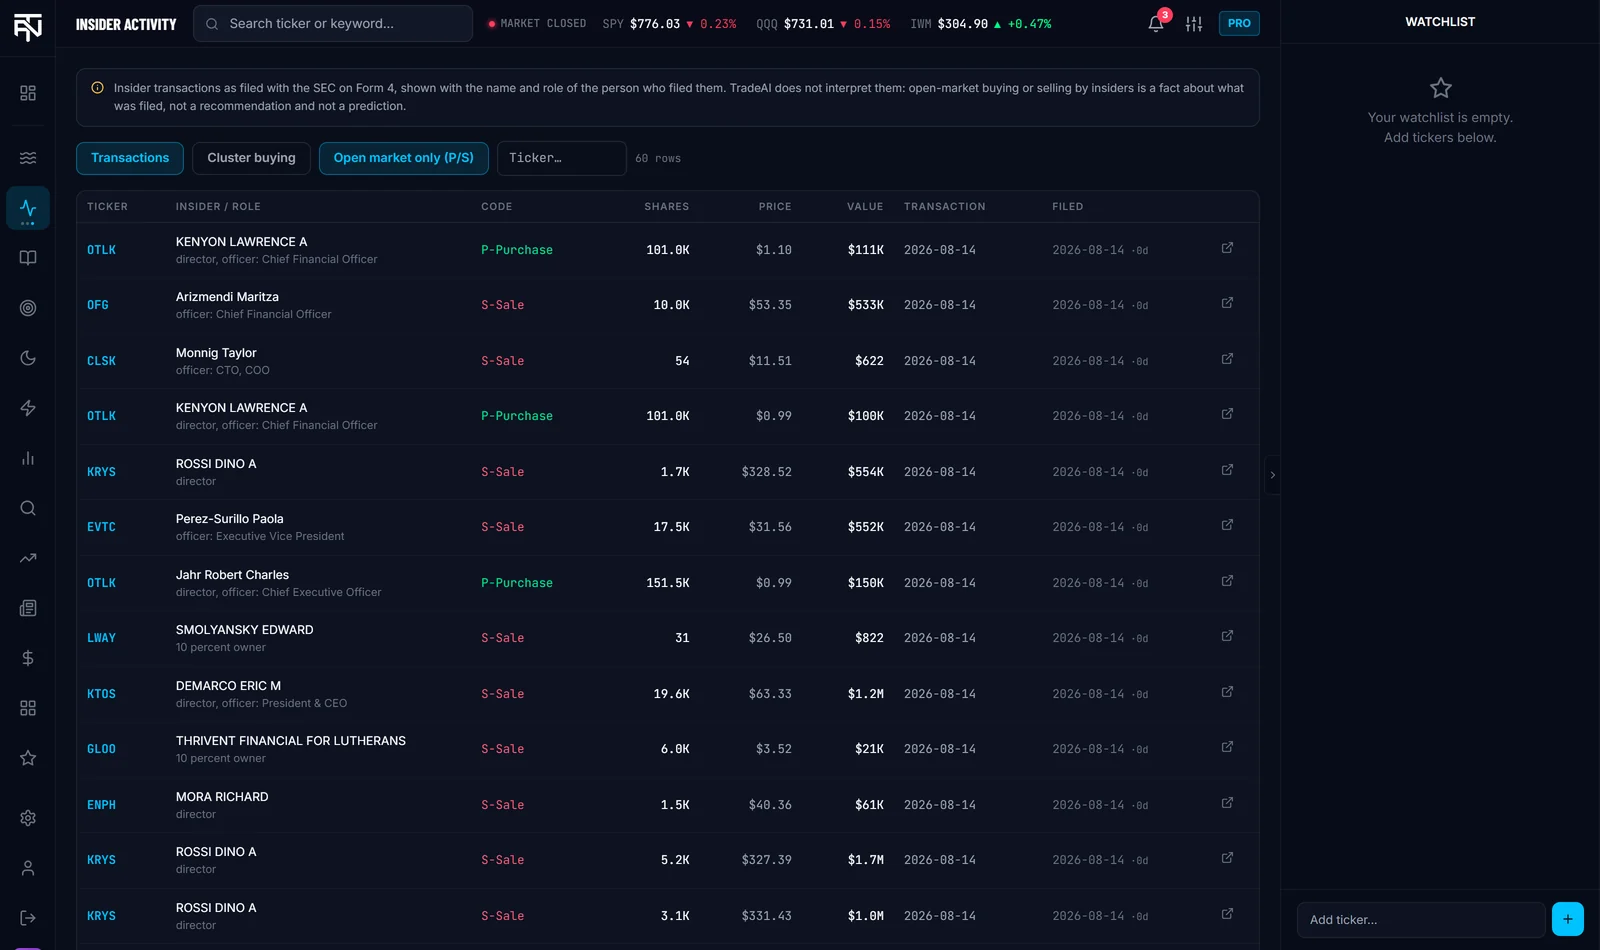
Real dashboard — attributed public filings.
How the tracker works →Market analysis, scanner, movers & more
The working views around the feed: a momentum scanner with hard quality filters, top movers, a sector heatmap, and unusual-volume detection (RVOL against each ticker’s own baseline).
- ▸Unusual volume is measured against the ticker’s own history — a statistical statement, not a label of buying or selling
- ▸Sector heatmap and movers for the broader tape at a glance
Per-ticker structural context
One page per covered ticker — 3,528 as of 2026-09-24, only where substantive data exists — combining short interest, fails-to-deliver, insider activity and analyst context with as-of dates on every figure. No account required for the teaser.
- ▸Curated set: no thin pages, ever — a ticker without data has no page
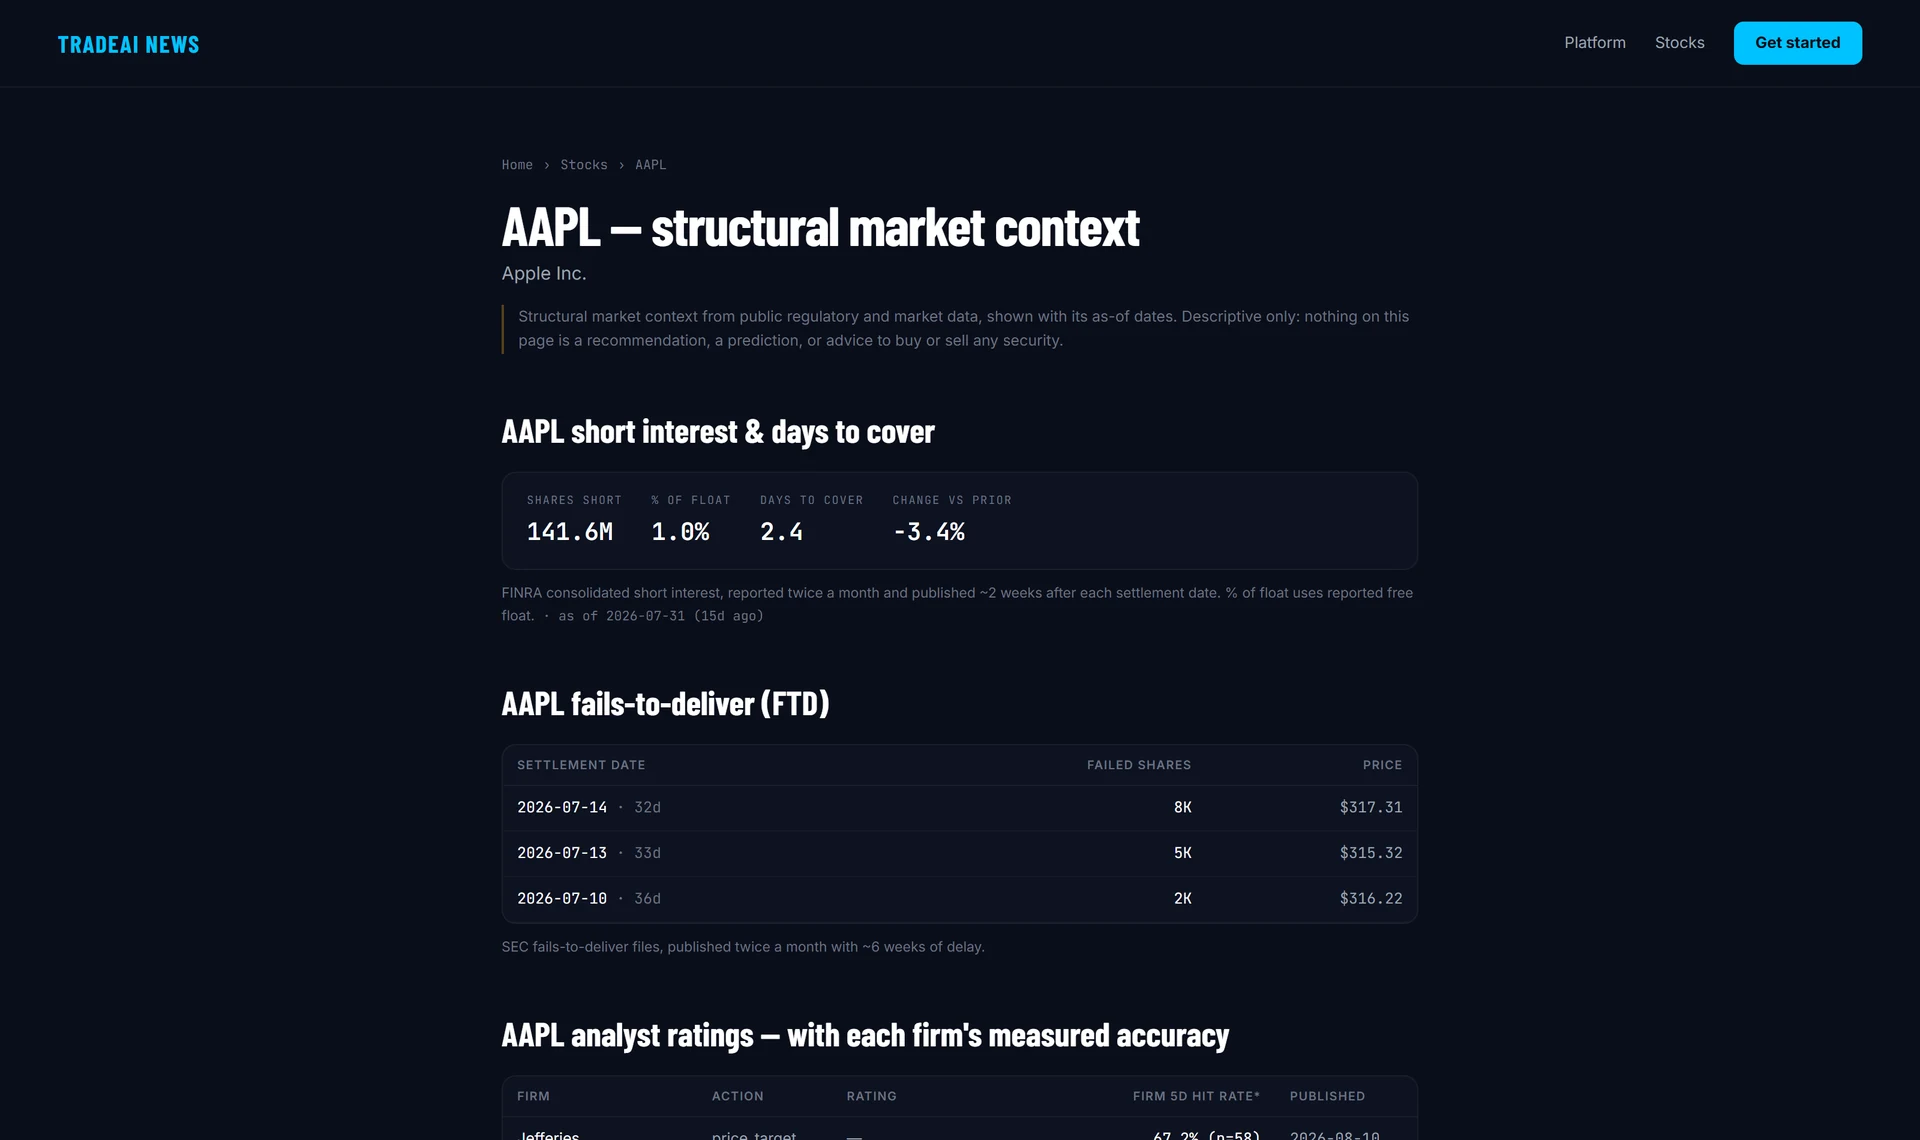
Real page — public regulatory data with as-of dates.
Browse covered tickers →Customer REST API
Programmatic access to the scored event feed and per-event context for Elite subscribers: up to 3 API keys, 60 requests/minute, JSON responses, full documentation in the API reference. The same honest data the dashboard shows — scores and context, never directional calls.
API reference →18 news & regulatory feeds delivering. 4 market-data providers.
We name what we ingest, and we only name what is actually delivering. A feed appears in this list only if it produced at least one item in the last seven days — measured against the ingestion log, not read off a config file. Feeds that go quiet drop off it.
MEASURED 2026-09-02 · 7-DAY WINDOW
See it with your own data
Free tier, no credit card. The live SPY gamma view is public before you even sign up.
Not financial advice. Trading involves risk. TradeAI News provides structural market context — significance and magnitude, never direction. Dashboard captures show live market data or labeled demo-account data; none are performance claims.
Last updated September 16, 2026