MARKET STRUCTURE FOR TRADERS · US EQUITIES

The structure
behind the move.

Gamma structure, unusual volume, filings, portfolio research and the market context behind your trades — in one workspace.

No card required · Every Pro feature for 21 days · Then the Free plan, unless you choose one · One trial per person

We measure significance and magnitude, never direction.

TradeAI News dashboard: SPY estimated gamma exposure by strike at the close of Oct 22, 2026, with call wall, put wall and gamma flip
Dashboard capture, Oct 22, 2026. SPY estimated gamma exposure by strike at the close (last snapshot of the session): call wall, put wall and gamma flip. Open interest as published by OCC, with its date on the chart.

One workspace, several ways in.

Pick the door that matches how you use the market. Everything else is one click away.

I TRADE OPTIONS

Where estimated options positioning sits

See estimated gamma by strike behind each closed SPY session, with the call wall, put wall and gamma flip in front. Then go deeper in the Gamma Suite: implied moves, IV skew and term structure, and a volatility estimate shown with its measured error.

Gamma Heatmap · BasicGamma Exposure · ProVolatility estimate · Pro
Guide: the gamma flip →Free expected move calculator →
Gamma Heatmap: estimated SPY gamma by strike behind the candles of the closed session of Oct 21, 2026, with walls, flip and session VWAP
Capture, Oct 22, 2026 · Estimated, not observed. Session of Oct 21, 2026 (closed). Open interest as of Oct 19, 2026
I FOLLOW A WATCHLIST

What changed on the tickers you follow

Today puts the index and sector ETFs, market events and unusual volume on one page. Your watchlist keeps your tickers in lists, What Changed shows the largest changes across them in each data layer, and the search box finds any covered ticker as you type.

Today · FreeWatchlist · FreeWhat Changed · ProTicker search · All plans
Guide: premarket trading →
Watchlist: a list of five tickers with their last price and change
Capture, Oct 22, 2026
I MANAGE A PORTFOLIO

How your portfolio is built, and how it holds up in hypothetical scenarios

Portfolio Research reads your positions as a report: drawdown, allocation by position and sector, risk contribution and correlations, each chart with its as-of date and window. Try it first on the Sample portfolio, with no one’s data, and run the Stress Lab’s hypothetical shocks on it.

Portfolio Research · ProSample portfolio · Any planStress Lab · EliteAllocation Models · Elite
Sample portfolio: allocation by position and by sector
Capture, Oct 22, 2026 · Sample portfolio, no one’s data
I RESEARCH MARKETS

The market’s structure, session by session

Changed Together lists tickers whose data layers changed in the same week, listed and not ranked. Structural Anomalies shows measurements far from a ticker’s own history, with percentile and n. Event Study measures how much tickers moved around earnings dates and SEC filings, compared with a market model and with random dates of the same tickers — and says plainly when a kind of event looks no different from a random day. The Market Regime Atlas labels Calm, Normal or Stressed volatility at each close and never revises it, and the Market Time Machine shows a past date with only what was public by its close.

Changed Together · ProStructural Anomalies · ProEvent Study · ProMarket Regime Atlas · ProMarket Time Machine · ProLabs · Elite
Market Regime Atlas: SPY current volatility regime, the three regimes and the history labeled at each close
Capture, Oct 22, 2026
I REVIEW MY TRADES

Your trades, with the market they happened in

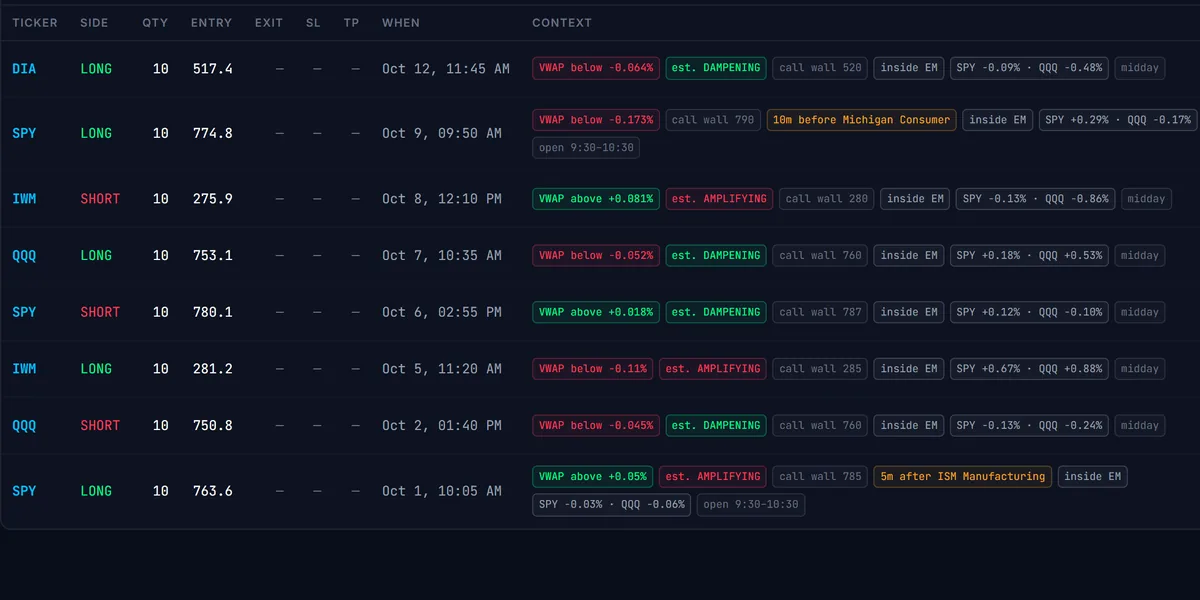
Import a CSV or Excel export from your broker, or log trades by hand. Each trade keeps the conditions at entry: gamma regime, market events and the macro calendar. The Research Lab groups and compares your own fills by those conditions. It describes your trades; it never grades them.

Context Journal · ProResearch Lab · Pro
Context Journal: each trade with the market conditions at entry (demo account)
Capture, Oct 13, 2026 · Demo account, synthetic trades

Seven suites, one workspace.

Full feature breakdown →Market events in context →

Guides: The gamma flip · Options market structure · Form 4 transaction codes · SEC offering filings · Market events · All guides

Real data, not a mockup.

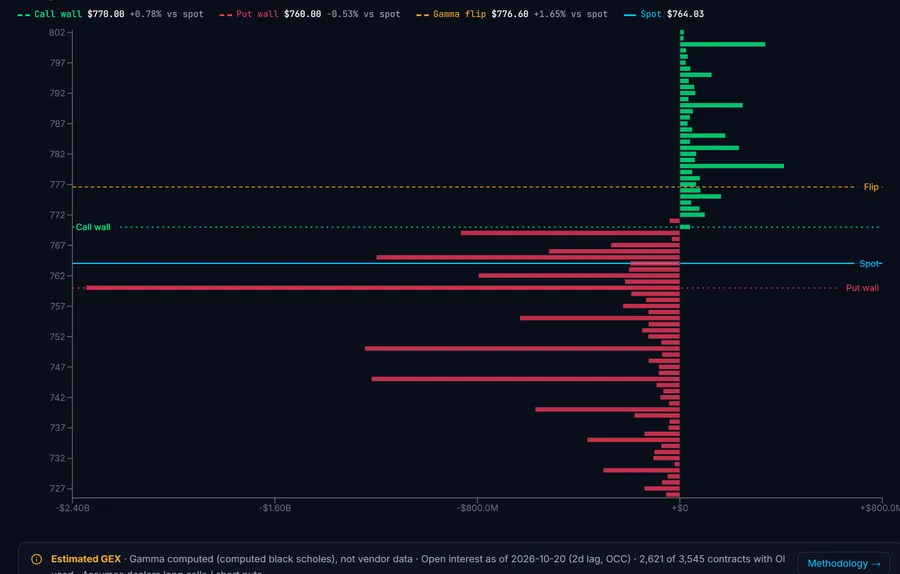
Estimated gamma exposure across hypothetical spot prices, computed from the options chain. Open interest is OCC data from two trading sessions earlier, so it trails the price; the note below the chart says how it is calculated and how old the data is.

SPY · as of Nov 6, 03:55 PM EST
OI as of 2026-11-04 (two sessions earlier)
Net Gamma vs Spot
SPOT
$735.52
NET GEX
-$11.86B
NET SHARE
61.38%
GAMMA FLIP
$769.64
EXPECTED MOVE · 1D
±$9.64 (±1.31%)
From ATM implied volatility, fixed at the close of Nov 6 for the Nov 9 expiration · Size, not direction.
HOW THIS IS CALCULATED
Estimated Gamma Exposure. Gamma is not vendor data: it is computed with Black-Scholes from an implied volatility back-solved from the bid-ask mid. Open interest is published by OCC after settlement and reaches us two sessions later (T-2 sessions). Contracts expiring on the current New York date are not included during their own session: days to expiration is counted in whole calendar days, so a same-day expiration counts as zero. The sign of each strike follows the usual published convention: call gamma counts as positive and put gamma as negative, which assumes dealers are long calls and short puts. It is an assumption, not an observed position. Not investment advice.
This is SPY, refreshed during the session. The dashboard covers the tickers in our gamma universe.
SPY gamma map: the latest closed session by strike →
Explore the gamma universe with the Pro trial →

Measured. Dated. Connected.

01

Measured in-house or taken from the filing

Gamma is estimated with Black-Scholes from the options chain, not bought from a vendor. Short interest comes from FINRA, fails-to-deliver from the SEC, insider trades from Form 4 filings, and volume is compared with each ticker’s own baseline.

02

Every figure carries its date

Lagged data says how old it is: options open interest arrives after OCC settlement, and short interest follows FINRA’s twice-monthly schedule. Estimates carry their measured error, and scenarios are labeled hypothetical.

03

Connected to your trades

Market events and the financial calendar sit next to the structure, and the journal keeps all of it at every entry.

How the platform works →Why we don’t predict direction →

Data from: FMP · Alpaca + OCC · FINRA · SEC

Start with Pro for 21 days.
Keep what you need.

Free

$0
No card required
  • +Today
  • +Market events preview
  • +Financial Calendar
  • +Watchlist
  • +Compare
  • +Sample portfolio
  • +Ticker search

Basic

$29/mo
Everything in Free, plus:
  • +Full Market Events feed
  • +Market Map
  • +Movers
  • +Scanner
  • +Gamma Heatmap
  • +A 60-day preview of the Gamma Suite and the Context Journal

First month free with a card, then $29/month. Cancel anytime.

Pro

$59/mo
Everything in Basic, plus:
  • +Gamma Exposure
  • +Context Journal
  • +Analyst Ratings
  • +Short Interest & FTD
  • +Insider Activity
  • +Market Brief
  • +Unusual Volume
  • +Volatility estimate
  • +Sensitivity lab
  • +Regime transitions
  • +Offering Filings
  • +Changed Together, all tickers
  • +Structural Anomalies
  • +Market Regime Atlas
  • +Market Time Machine
  • +Event Study
  • +What Changed (7 and 30 days)
  • +Portfolio Research
  • +Research Lab
  • +Unusual moves (Market Events)

First month free with a card, then $59/month. Cancel anytime.

Elite

$99/mo
Everything in Pro, plus:
  • +Stress Lab on your own portfolio
  • +Changed Together across all tickers, full stored history
  • +Allocation Models, up to 40 assets per model
  • +Research Lab on your own trades: 200 saved queries, up to 4 cohorts compared, 2-level Group by
  • +Labs: early access to new research tools
  • +Changed Together export (CSV)
  • +Full history in the Research Desk

First month free with a card, then $99/month. Cancel anytime.

Before you start

What is TradeAI News?

A research workspace for US equities in seven suites: estimated gamma and options structure, market events and unusual volume, insider and offering filings, short interest, portfolio research, market research tools and a journal that keeps the market conditions of every trade. We measure significance and magnitude, never direction.

What does the free Pro trial include?

Every Pro feature for 21 days: the Gamma Suite, the Context Journal and Research Lab, Portfolio Research, the Research Desk, What Changed and the Intelligence suite. No card is required, and there is one trial per person.

What happens when the trial ends?

Your account moves to the Free plan. Nothing is charged, because no card was taken. You can choose a plan at any time, before or after the trial ends. Your journal trades stay in your account: on Free you can view, export or delete them.

Do you tell me what to trade?

No. There are no recommendations and no price predictions. The platform describes what is in place — positioning, filings, volume, short interest, portfolio structure — and the decision stays yours. Stress Lab scenarios are hypothetical, and every estimate is shown with its error.

How current is the data?

Each figure shows its as-of date. Options open interest arrives after OCC publishes it at settlement, and the methodology note on each chart says how many sessions behind it is. Short interest follows FINRA’s twice-monthly schedule, and insider trades appear once the Form 4 is filed with the SEC.

More questions →

See the structure behind your next trade.

21 days of every Pro feature. No card required.

Not financial advice. Trading involves risk.

Last updated November 7, 2026