Gamma Suite · estimated options positioning
Where estimated SPY gamma sat, strike by strike, through the session
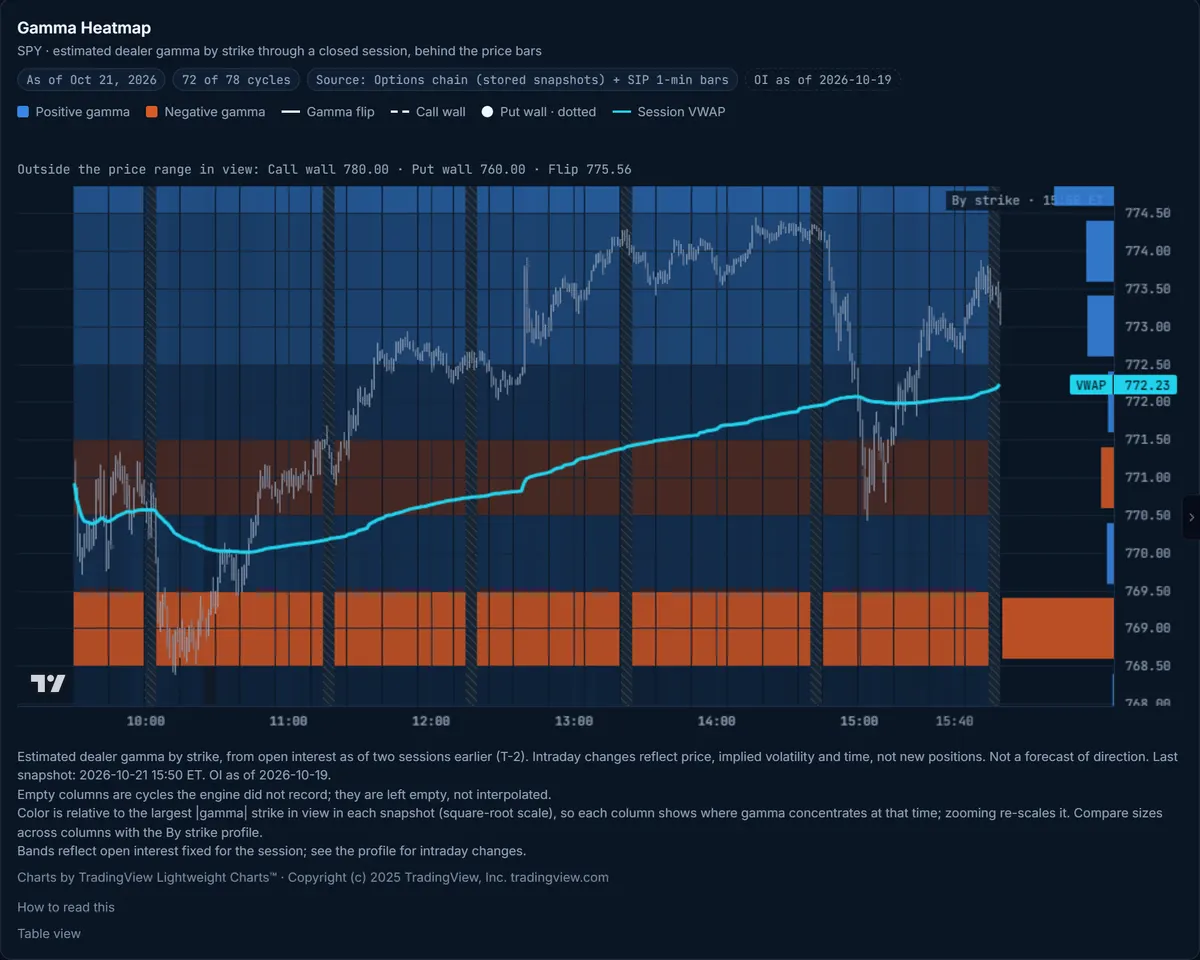
A gamma-by-strike chart is one snapshot. The Gamma Heatmap shows how the estimated profile looked at each intraday cycle of a closed session, behind that session’s candles, with the walls, the flip and the expected-move band in front. It is an estimate from public open interest, and it says so on every map.
Estimated gamma by strike for SPY, public and without login.Open the public SPY gamma view →
What the zero-gamma level is, how it is estimated and why it moves.Read the gamma flip guide →
What you get
Strike × time
Estimated gamma at each strike for each intraday cycle of the session, behind the candles.
Levels in front
Call wall, put wall, gamma flip and the expected-move band, as estimated at each cycle.
Closed sessions only
Every map is a session that has ended; cycles that were not recorded are marked, never filled in.
Your view, your settings
Timeframes from 1 minute to 1 hour, several sessions in a row on the wider ones, and classic indicators computed on the same bars.
HOW THIS IS CALCULATED
Gamma exposure per strike = gamma × open interest × 100 × spot² × 1%, in dollars per 1% move; calls count as positive and puts as negative. Open interest is published with a lag of two trading sessions and each map shows its date. The map is computed for closed sessions only. It is an estimate of options positioning, not observed dealer inventory, and it carries no direction.
Frequently asked questions
What does the Gamma Heatmap show?
Estimated gamma exposure of SPY options at each strike, recomputed through the session, painted behind that session’s price candles. Blue cells are strikes where the estimated gamma is positive and orange cells where it is negative. The call wall, the put wall, the gamma flip and the expected-move band are drawn in front.
Is this the real dealer position?
No. It is an estimate built from public open interest and a standard sign convention (calls positive, puts negative). Dealers’ actual books are not public. The map shows where estimated gamma sat, not what anyone holds.
How current is it?
Each map is a closed session: the page does not draw an open one. Open interest arrives with a lag of two trading sessions, and every map states the open-interest date it used. Cycles that were not recorded are shown hatched, never filled in.
Does a color tell me where SPY will go?
No. The colors are the sign of the estimated gamma, not a forecast. Positive and negative gamma describe how hedging flows are usually modeled, and the market often does something else. We publish no direction on any page.
Which plan includes it?
Basic: basic view: the last closed session, with price bars, call wall, put wall and gamma flip. Every closed session since Oct 19, 2026, with the heatmap, expected move band, volume bubbles and markers, is included with Pro.
See the session behind the levels
The Gamma Heatmap is in the Gamma Suite, from the Basic plan.
Not financial advice. Trading involves risk. TradeAI News provides structural market context, not directional recommendations.
Last updated October 28, 2026