My Workspace · descriptive, never a forecast
How your portfolio is built, and how it holds up in hypothetical scenarios
Enter your positions and read the portfolio as a report: where the weight sits, which positions carry the risk, how they move together and how deep the drawdowns were. Then apply hypothetical shocks to the current weights. Every chart states its as-of date and window.
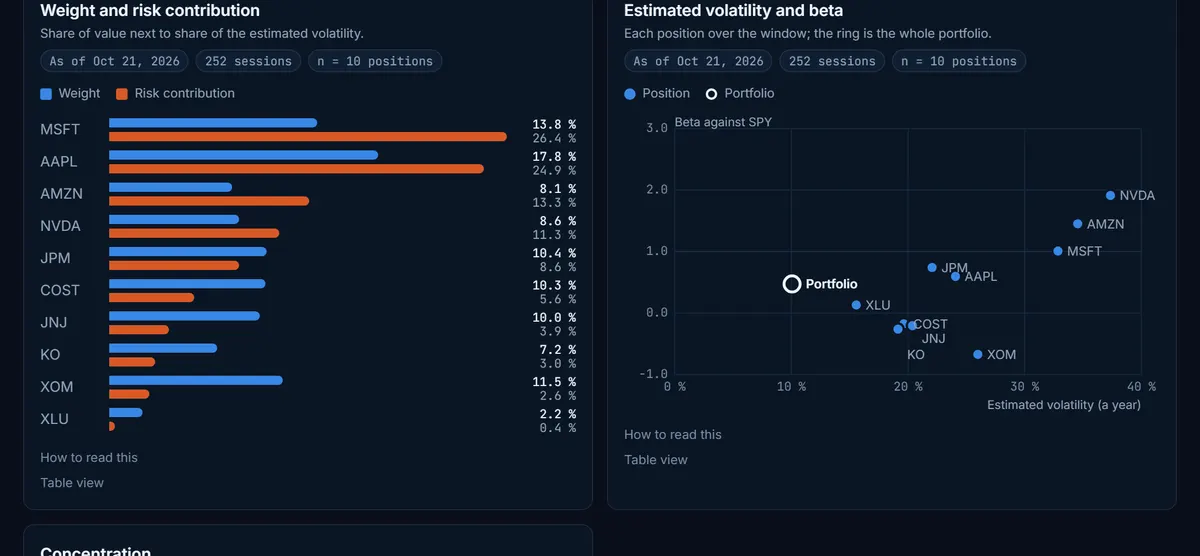
A fixed portfolio with no one’s data: every chart, before you enter your own.Explore the Sample portfolio →
What you get
Portfolio Research
Your positions read as a report: drawdown, allocation by position and sector, risk contribution, correlations and concentration, each chart with its as-of date and window.
Stress Lab
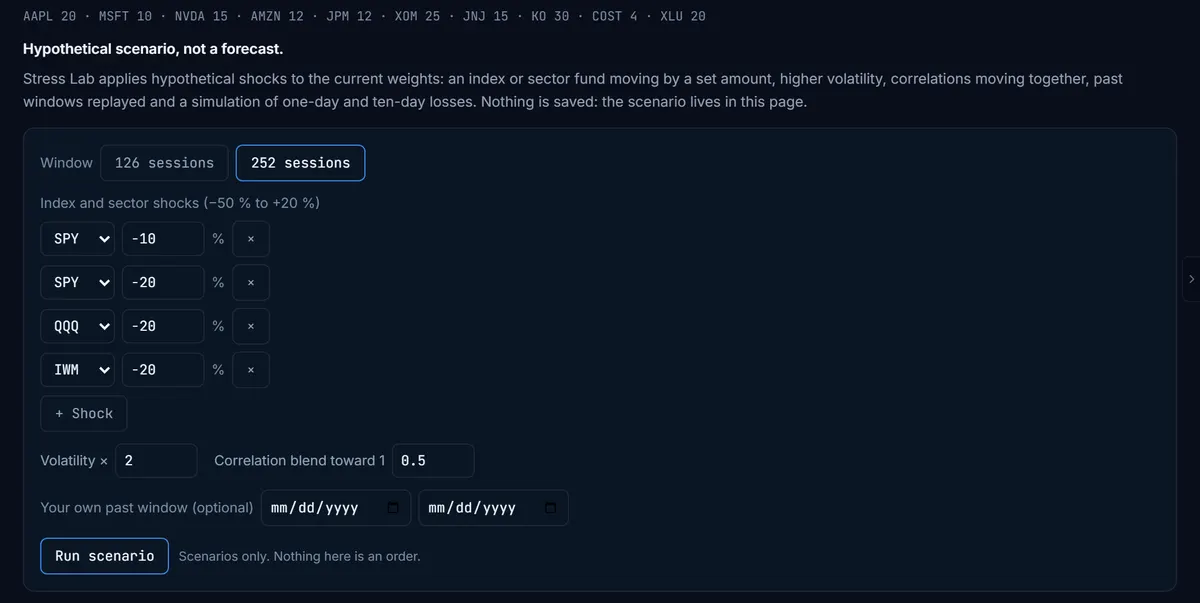
Hypothetical index and sector shocks, simulated volatility and correlation shocks, and the worst past windows, applied to a portfolio’s current weights. Nothing here is a forecast.
Allocation Models
Several standard allocation methods side by side on your positions, under the assumptions you choose, with sensitivity bands.
Sample portfolio
A fixed portfolio, with no one’s data, to see every Portfolio Research chart before you enter your own.
HOW THIS IS CALCULATED
Prices are daily closes; daily changes, correlations and risk contributions are computed over the window shown on each chart. Stress scenarios apply a stated shock to the portfolio’s current weights: index and sector shocks are hypothetical moves, volatility and correlation shocks are simulated, and the worst past windows are replayed from history. None of these is a forecast, and no chart suggests a trade or a weight.
Frequently asked questions
What does the portfolio report show?
Your positions read as a report: drawdown, allocation by position and sector, risk contribution, correlations and concentration, each chart with its as-of date and window.
What is the Stress Lab?
Hypothetical index and sector shocks, simulated volatility and correlation shocks, and the worst past windows, applied to a portfolio’s current weights. Nothing here is a forecast.
Will it tell me what to trade or how to weight my positions?
No. Every chart describes the portfolio you entered under stated assumptions. Scenarios are hypothetical and the worst past windows are history, not a forecast. Nothing on these pages is a recommendation about weights or trades.
Can I try it without entering my own positions?
Yes. A fixed portfolio, with no one’s data, to see every Portfolio Research chart before you enter your own. It is available to any signed-in account, including Free.
Which plan includes it?
Portfolio Research is on Pro (1 portfolio, up to 50 positions). The Stress Lab and Allocation Models are on Elite, with up to 5 portfolios of 100 positions.
Read your portfolio as a report
Portfolio Research is in My Workspace on the Pro plan; the Stress Lab on Elite.
Not financial advice. Trading involves risk. TradeAI News provides structural market context, not directional recommendations.
Last updated October 28, 2026